
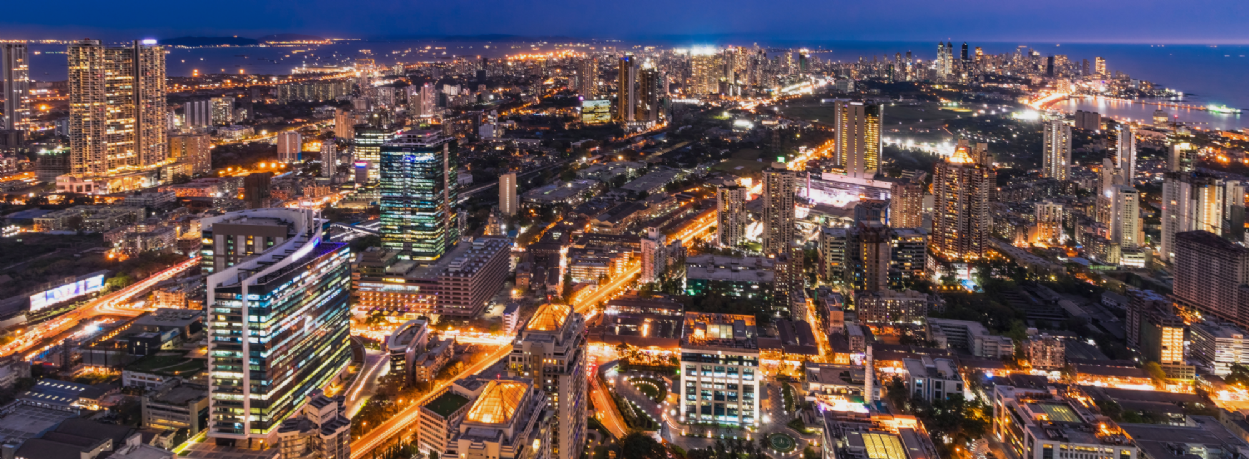
A flight to quality continues to characterise many prime office markets globally, with organisations prioritising premium offices, concentrating demand on the best buildings in the most desirable locations. This is particularly evident in markets such as New York, Mumbai and Warsaw, where limited availability of best-in-class space and resilient demand continue to place upward pressure on costs.
Contents
In some markets, however, occupier costs for best-in-class offices are softening. Costs in Cairo eased this quarter after a period of stable prices, while mainland Chinese markets continue to adjust to significant oversupply.
This report examines best-in-class prime office space, focusing on trophy or ultra-prime buildings that often follow different market dynamics from the wider Grade A office market. This report examines the top tier of the prime market, focusing on the top five highest-priced buildings in each market. For a full definition, see article notes.
Key takeaways:
- Across the 47 global cities we analyse in this report, prime office occupier costs rose by 1.3% in Q3 2026, bringing the year-on-year (YoY) change to 4.7%.
- Markets with significant quarterly cost rises include Mumbai (8% in Q3), New York Downtown (7% in Q3), Warsaw (4% in Q3) and Prague (5% in Q3), where limited availability of best-in-class space and resilient business demand continue to place upward pressure on costs.
- Demand for premium best-in-class prime office space remains elevated. Several markets are reporting historically high face rents, with standout examples like hedge fund Castle Hook’s lease setting a record in New York.
Regional highlights
Net effective occupier costs increased across 30 of the 47 cities analysed in Q3 2026, reflecting continued rises in gross rents and ongoing pressure on fit-out costs. By region, occupier costs rose by 0.9% in Asia Pacific, 0.6% in EMEA and 2.5% in North America (QoQ).
US cities are among the fastest-rising occupier cost markets globally, led by New York and Dallas. These are markets showing strong demand for best-in-class, highly amenitised space, while supply for the highest quality offices remains constrained.
New York (Midtown) recorded a 4.9% increase in occupier costs QoQ, taking annual increases to 13.7%. At $225 per sq ft, Midtown is now the fourth most expensive market we monitor, behind London's West End, Hong Kong and Tokyo, driven by higher face rents and shorter rent-free periods.
Office space at the top of the market is extremely limited, with vacancy across Midtown's trophy buildings falling below 1.9%, from 17% at the end of 2024.
Scarcity is pushing rents to new highs. In what is reported to be New York's most expensive office letting on record, hedge fund Castle Hook has agreed a 15-year lease on the top two floors of Related's 625 Madison Avenue tower at approximately $375 per sq ft. The building won't complete until 2029, underlining how far in advance businesses will commit to secure the best space.
Downtown New York also witnessed sharp increases in net occupier costs, up 6.9% over the quarter. Face rents rose by 9% as prime vacancy fell to 10.4%, from 27.4% two years ago, limiting choice and placing upward pressure on rents for best-in-class space.
The Asia Pacific region recorded a modest 0.9% increase in occupier costs this quarter, although the regional average continues to mask a widening divergence between mainland China and the rest of the region.
Occupier costs across the four mainland Chinese markets we monitor fell by -0.7% in Q3 and are now -4.4% lower YoY. Excluding China, occupier costs in the region increased by an average of 1.4% over the quarter and 7% annually, which shows continued strength across many of Asia Pacific's established office markets.
Melbourne and Manila recorded some of the region's largest quarterly increases, with occupier costs rising by 2.5% and 2%, respectively. Melbourne, which has lagged Sydney's recovery since the pandemic, continues to see demand improve as many businesses look to it as a cost-efficient business centre in Australia, with costs up 10.7% YoY.
Mainland China remains the region's clear outlier. Occupier costs have fallen by 11.4% over the past two years as significant new supply has coincided with subdued economic growth and weaker business confidence. Beijing recorded the largest quarterly fall globally, down 3.4%, while Shenzhen bucked the trend with a 2.2% rise QoQ, supported by the continued expansion of its technology and AI sectors.
Mumbai has become one of the world's fastest-growing prime office markets, attracting multinational occupiers drawn by its deep and highly skilled talent pool. Occupier costs rose by 7.6% QoQ, the largest increase of any market we monitor, and are 21% higher YoY. Face rents in the city's top five buildings have almost doubled since 2019, with most of these increases occurring since the end of 2024. Record leasing this year has pushed prime office vacancy down to 1.1%.
Europe, the Middle East and Africa recorded a 0.6% increase in net effective occupier costs.
Prague and Warsaw recorded the region's largest quarterly increases in occupier costs, rising by 4.5% and 4.2%, respectively. Elsewhere, Dubai rose by 1.6% due to higher fit-out costs, while London City saw a more modest 0.5% increase.
Central European cities record significant increases in occupier costs. In Warsaw, face rents rose by 4.4% QoQ , given demand from international businesses and a constrained supply. In Q3 2026, prime office vacancy in the newest buildings fell to 1.25%. Warsaw has 1.4 million sq ft of new office stock in its construction pipeline, with most of that delivering high-quality space in the city centre. The pipeline may ease supply-demand dynamics and reduce cost pressures.
In Prague, face rents rose by a similar 3% QoQ, but it is fit-out costs that have been the main driver of increasing occupier costs. Premium fit-out costs rose by 6% this quarter and around 70% since Q2 2024. As a result, despite alike face rents in Warsaw and Prague, occupier costs are higher in Prague, where tenants typically bear the cost of fitting out their offices. In Poland, landlords generally cover these costs as a leasing incentive.
Despite these increases, both cities remain among Europe's more affordable office markets. Net effective occupancy costs in Warsaw are 63% below the EMEA average, while Prague sits 44% lower this quarter.
Methodology
The Prime Office Costs Index presents a quarterly snapshot of occupancy costs for prime office space throughout the world, as provided by our expert, local tenant representation professionals and researchers.
The adjusted annual all-in occupancy cost represents real-time transaction terms for 20,000 square feet (2,000 square metres) of usable space based on a basket of the top five most expensive properties to calculate averages representing the top tier of the prime market in each location.
All costs are reported in an annual, standardised format of USD per square foot of usable space to account for variations in currency, reflect local payment protocols, and adjust for measurement practices across the globe. We have also factored in the credit value to the tenant generated from abated rent and the cost associated with fitting out the premises in order to provide an ’all in‘ total occupancy cost in USD per usable square foot.
The fit-out costs were gathered from local Savills teams assuming the leasing scenario described above, plus the following:
i) 30% cellularisation with the remainder of space open plan,
ii) construction and cabling only (no furniture or professional fees).